HDSP-7401 Ver la hoja de datos (PDF) - Avago Technologies
Número de pieza
componentes Descripción
Fabricante
HDSP-7401 Datasheet PDF : 10 Pages
| |||
HER, Yellow, Green, Orange
23(5$7,21 ,1 7+,6
5(*,21 5(48,5(6
7(03(5$785(
23(5$7,1* 2) ,'&
0$;,080
23(5$7,21 ,1 7+,6
5(*,21 5(48,5(6
7(03(5$785(
23(5$7,1* 2) ,'&
0$;,080
+]
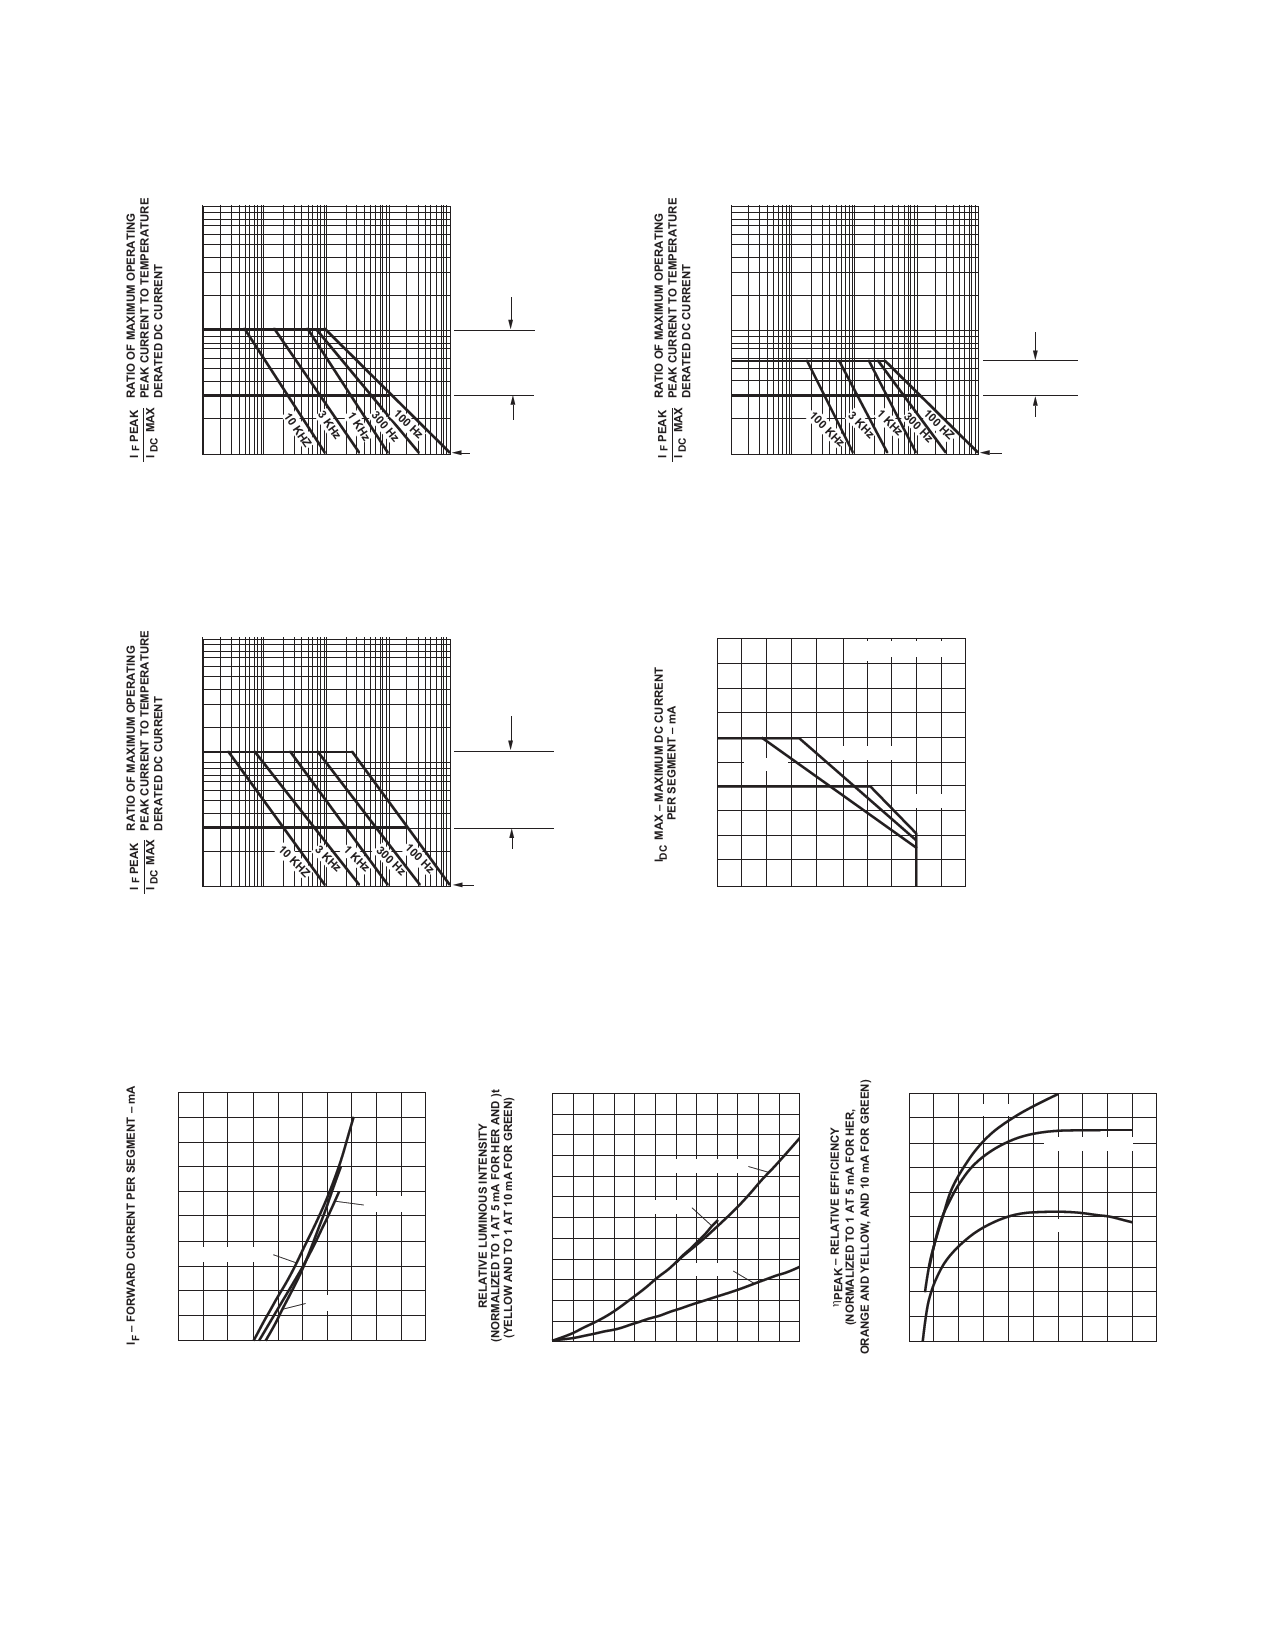
'& 23(5$7,21
W3 ± 38/6( '85$7,21 ± V
Figure 6. Maximum Tolerable Peak Current vs. Pulse Duration – HER, Orange.
.+]
.+]
.+]
+]
+=
'& 23(5$7,21
W3 ± 38/6( '85$7,21 ± V
Figure 7. Maximum Tolerable Peak Current vs. Pulse Duration – Yellow.
23(5$7,21 ,1 7+,6
5(*,21 5(48,5(6
7(03(5$785(
23(5$7,1* 2) ,'&
0$;,080
'& 23(5$7,21
W3 ± 38/6( '85$7,21 ± V
Figure 8. Allowable Peak Current vs. Pulse Duration – Green.
5T-$ &:
*5((1
+(5 25$1*(
<(//2:
7$ ± $0%,(17 7(03(5$785( ± &
Figure 9. Maximum Allowable DC Current per Segment as a Function of
Ambient Temperature.
<(//2:
+(5 25$1*(
*5((1
9) ± )25:$5' 92/7$*( ± 9
Figure 10. Forward Current vs. Forward Voltage
Characteristics.
+(5 25$1*(
<(//2:
*5((1
<(//2:
+(5 25$1*(
*5((1
,) ± )25:$5' &855(17 3(5 6(*0(17 ± P$
,3($. ± 3($. )25:$5' &855(17
3(5 6(*0(17 ± P$
Figure 11. Relative Luminous Intensity vs. DC
Forward Current.
Figure 12. Relative Efficiency (Luminous Intensity
per Unit Current) vs. Peak Current.
8
Share Link: 