HFBR-5107 Ver la hoja de datos (PDF) - HP => Agilent Technologies
Número de pieza
componentes Descripción
Fabricante
HFBR-5107
HP => Agilent Technologies

HFBR-5107 Datasheet PDF : 15 Pages
| |||
normally associated with these
technologies in the industry. The
Industry convention is 3 dB aging
for 800 nm and 1.5 dB for 1300
nm LEDs. The HP LEDs will
normally experience less than
1 dB of aging over normal com-
mercial equipment mission life
periods. Contact your
Hewlett-Packard sales repre-
sentatives for additional details.
Figure 4 was generated with a
Hewlett-Packard fiber optic link
module containing the current
industry conventions for fiber
cable specifications and the
100VG-AnyLAN Optical Param-
eters. These parameters are
reflected in the guaranteed
performance of the transceiver
specifications in this data sheet.
This same model has been used
extensively in the ANSI X3T and
IEEE committees, including the
ANSI X3T12 committee, to
establish the optical performance
requirements for various fiber
optic interface standards. The
cable parameters used come from
the ISO/IEC JTCI/SC 25/WG3
Generic Cabling for Customer
Premises per DIS 11801
document and the EIA/TIA568-A
Commercial Building Telecom-
munications Cabling Standard per
SP-2840.
Transceiver Signaling
Operating Rate Range
and BER Performance
For purposes of definition, the
symbol (Baud) rate, also called
signaling rate, is the reciprocal of
the shortest symbol time. Data
rate (bits/sec) is the symbol rate
divided by the encoding factor
used to encode the data
(symbols/bit).
When used in 100VG AnyLAN
100 Mbps applications, the
performance of the 1300 nm
transceiver is guaranteed over the
signaling rate of 10 MBd to
120 MBd to the full conditions
listed in the individual product
specification tables.
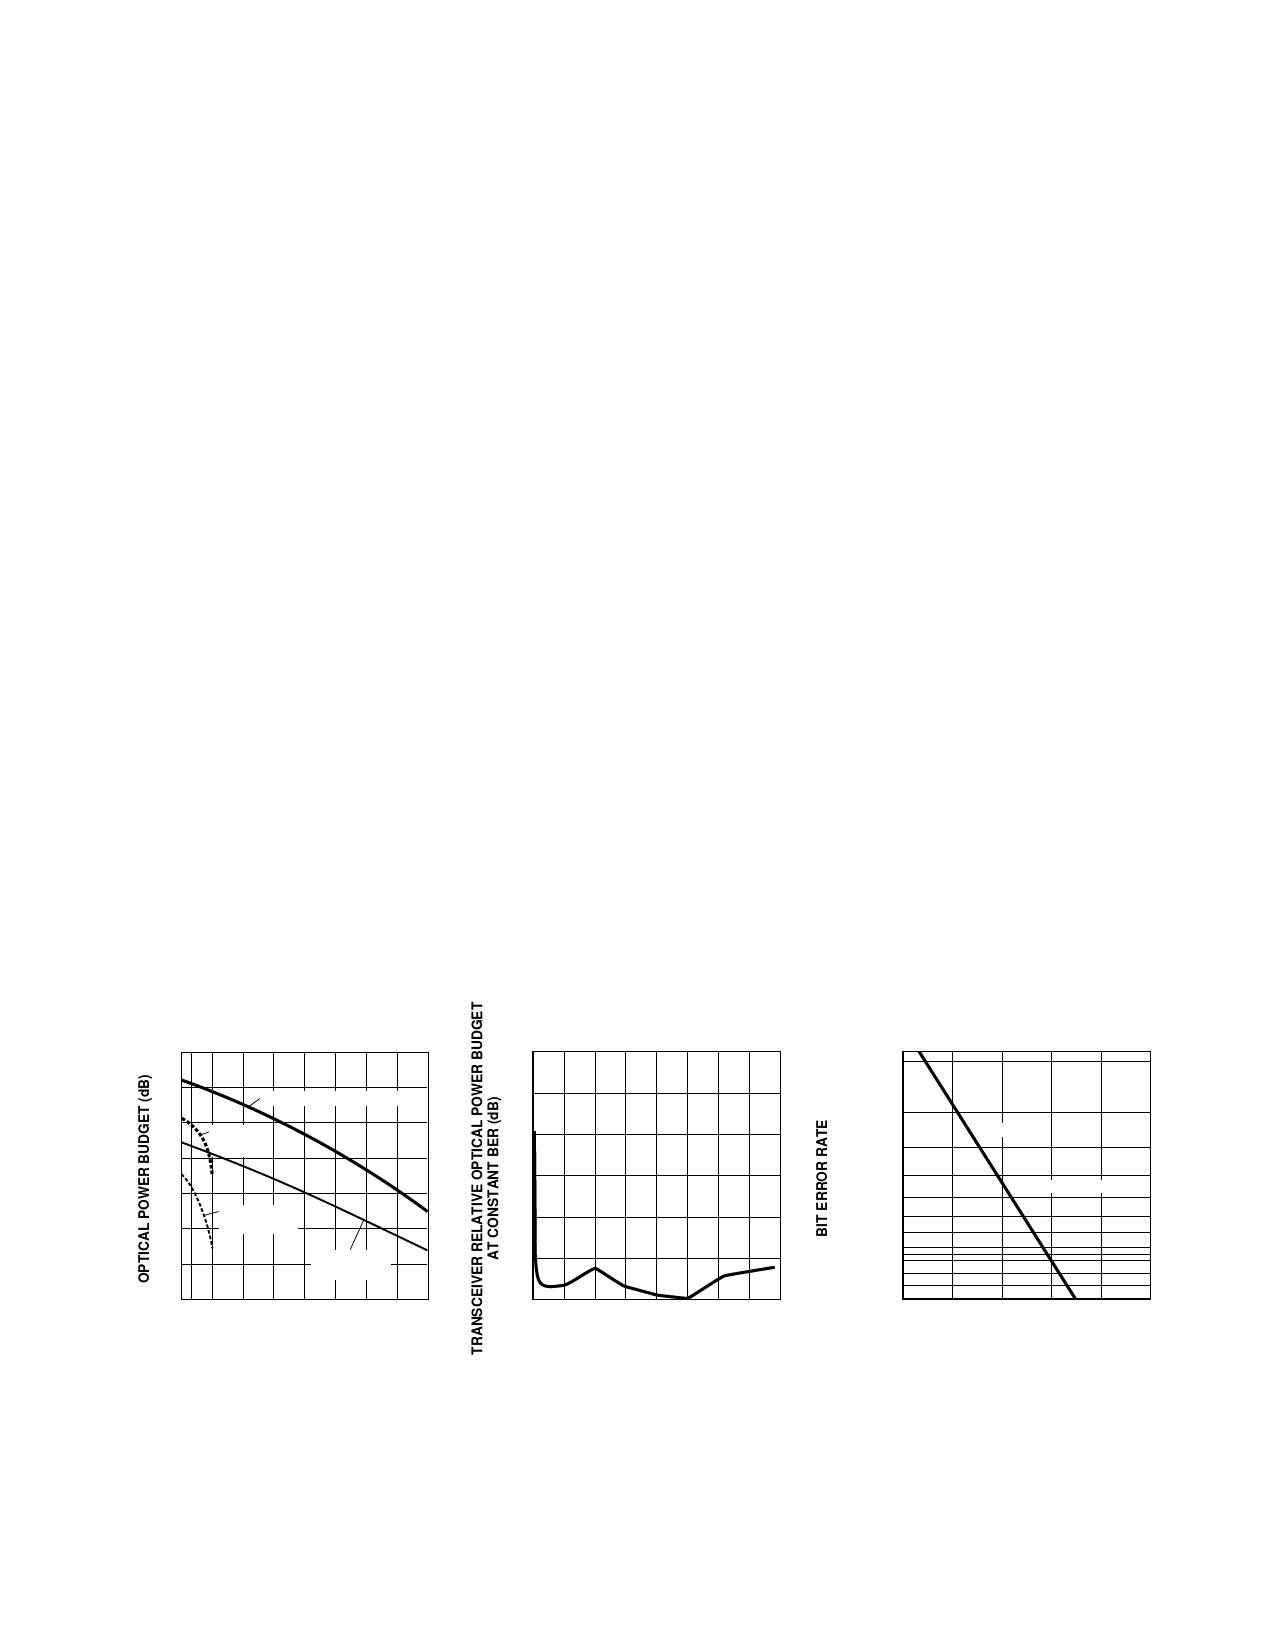
The transceivers may be used for
other applications at signaling
rates outside of the 10 MBd to
120 MBd range with some
penalty in the link optical power
budget primarily caused by a
reduction of receiver sensitivity.
Figure 5 gives an indication of
the typical performance of these
1300 nm products at different
rates.
These transceivers can also be
used for applications which
require different Bit Error Rate
(BER) performance. Figure 6
illustrates the typical trade-off
between link BER and the
receivers input optical power
level.
Table 1 lists the hub control
signals defined in IEEE 802.12,
section 18.5.4.1. These signal
rates are below 10 MBd but they
are transported with adequate
accuracy for hub access control.
Transceiver Jitter
Performance
The Hewlett-Packard 1300 nm
transceivers are designed to
operate per the system interface
jitter specifications listed in Table
27 of section 18.9. of the IEEE
802.12 (100VG-AnyLAN
standards).
14
12
HFBR-5106, 62.5/125 µm
10
HFBR-5107,
62.5/125 µm
8
6
HFBR-5107,
4
50/125 µm
2
HFBR-5106,
50/125 µm
0
0.15 0.5 1.0 1.5 2.0 2.5 3.0 3.5 4.0
FIBER OPTIC CABLE LENGTH (km)
Figure 4. Optical Power Budget at
BOL vs. Fiber Optic Cable Length.
154
3.0
1 x 10⁻²
2.5
1 x 10⁻³
2.0
HFBR-510X
1 x 10-4
1.5
1.0
0.5
0
0 25 50 75 100 125 150 175 200
1 x 10⁻⁵
1 x 10⁻⁶
1 x 10⁻⁷
1 x 10⁻⁸
2.5 x 10⁻¹⁰
1 x 10-11
1 x 10-12
-6 -4
CENTER OF SYMBOL
-2
0
2
4
SIGNAL RATE (MBd)
RELATIVE INPUT OPTICAL POWER – dB
CONDITIONS:
1. PRBS 27-1
2. DATA SAMPLED AT CENTER OF
DATA SYMBOL.
3. BER = 10-6
4. TA = 25° C
5. VCC = 5 Vdc
6. INPUT OPTICAL RISE/FALL TIMES = 1.0/2.1 ns.
CONDITIONS:
1. 125 MBd
2. PRBS 27-1
3. CENTER OF SYMBOL SAMPLING.
4. TA = 25° C
5. VCC = 5 Vdc
6. INPUT OPTICAL RISE/FALL TIMES
= 1.0/2.1 ns.
Figure 5. Transceiver Relative Optical
Power Budget at Constant BER vs.
Signaling Rate.
Figure 6. Bit Error Rate vs. Relative
Receiver Input Optical Power.
Share Link: