VLA502-01 Ver la hoja de datos (PDF) - Powerex
Número de pieza
componentes Descripción
Fabricante
VLA502-01 Datasheet PDF : 7 Pages
| |||
Powerex, Inc., 200 E. Hillis Street, Youngwood, Pennsylvania 15697-1800 (724) 925-7272
VLA502-01
Hybrid IC IGBT Gate Driver +
DC/DC Converter
START
VCE I>S VSC
NO
YES
IS
INPUT
SIGNAL
ON
NO
YES
DELAY
ttrip
YES
VCE I>S VSC
NO
YES
SLOW SHUTDOWN
DISABLE OUTPUT
SET FAULT SIGNAL
WAIT ttimer
YES
IS
INPUT
SIGNAL
OFF
NO
YES
CLEAR FAULT
SIGNAL
ENABLE OUTPUT
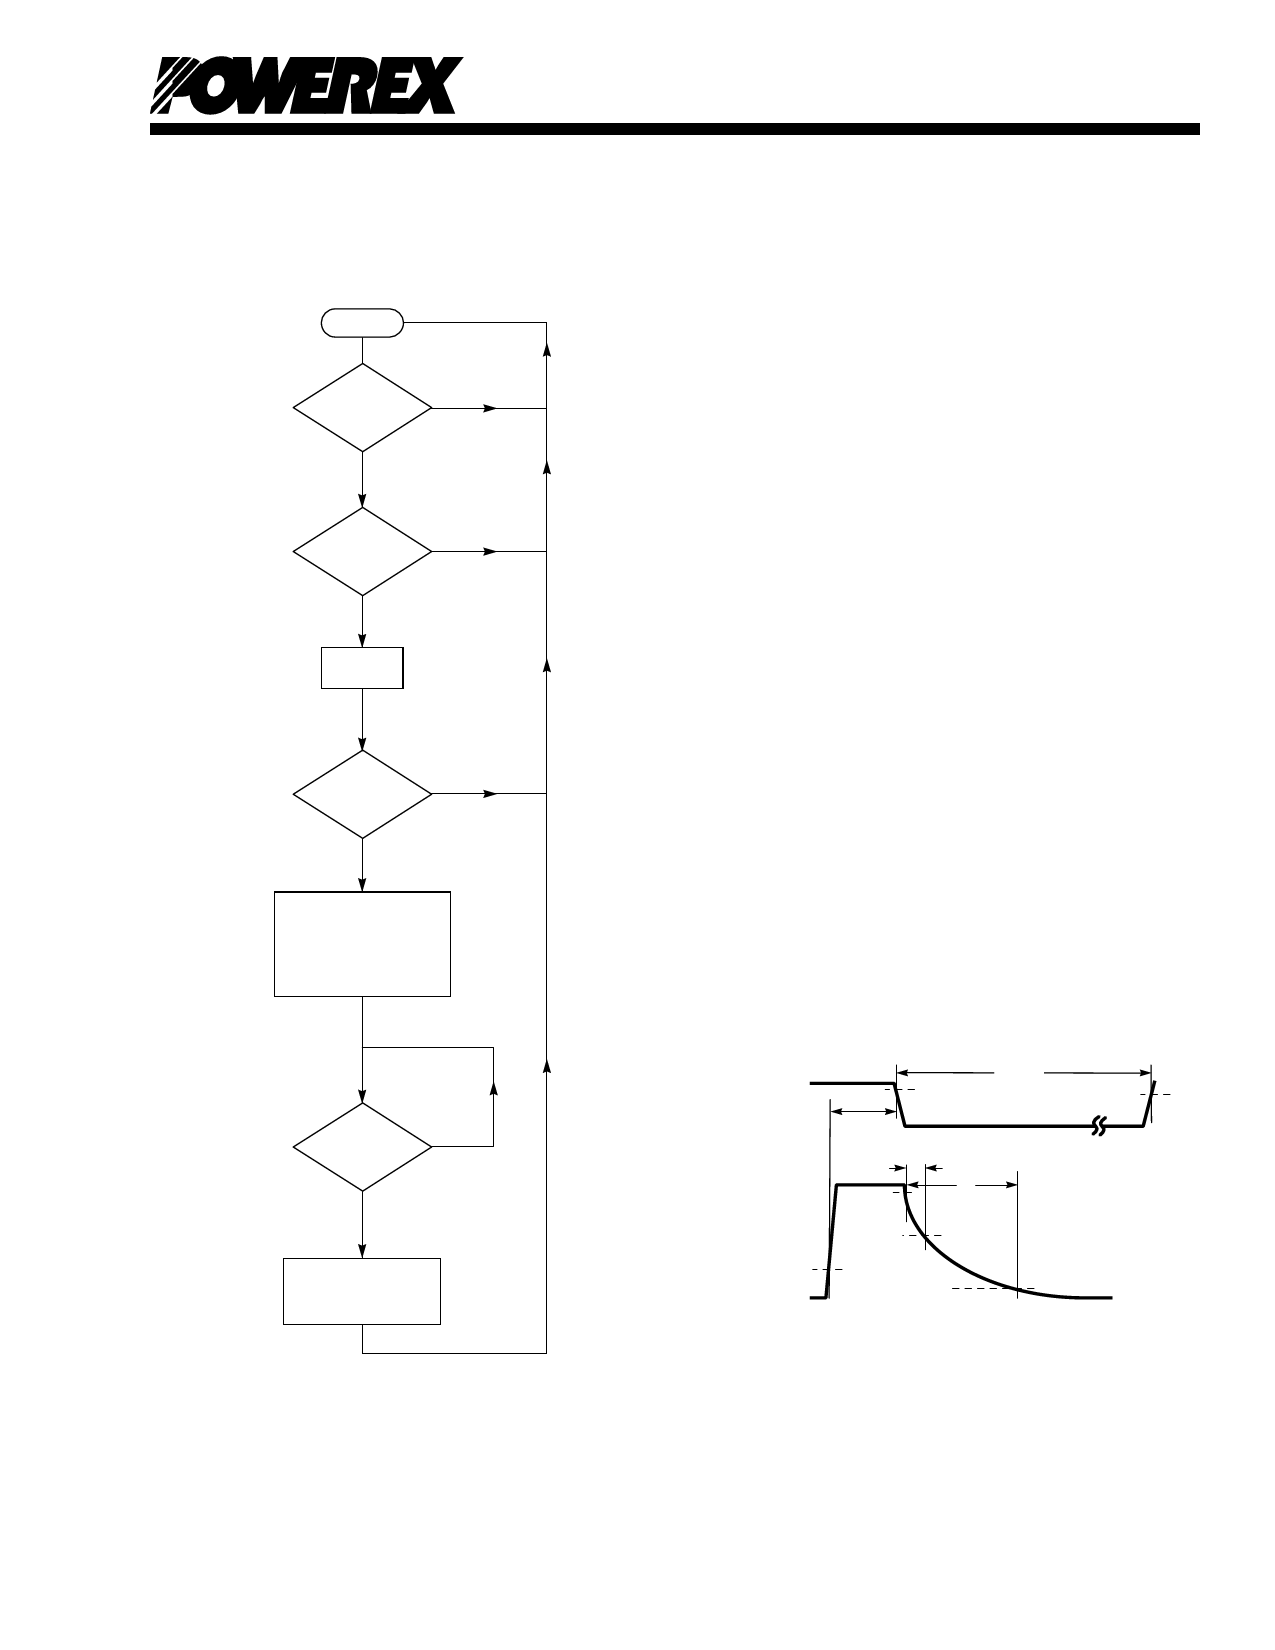
Figure 2. VLA502-01 Desaturation Detector
voltages. When RG is increased, the switching delay
time of the IGBT will also increase. If the delay becomes
long enough so that the voltage on the detect Pin 30 is
greater than VSC at the end of the ttrip delay the driver
will erroneously indicate that a short circuit has occurred.
To avoid this condition the VLA502-01 has provisions for
extending the ttrip delay by connecting a capacitor (Ctrip)
between Pin 29 and VEE (Pins 21 and 22). A curve
showing the effect of adding Ctrip on time is given in the
characteristic data section of this data sheet. The wave-
form defining trip time (ttrip) is shown in Figure 3. If ttrip
is extended care must be exercised not to exceed the
short-circuit withstanding capability of the IGBT module.
Adjustment of Soft Shutdown Speed
As noted above the VLA502-01 provides a soft turn-off
when a short circuit is detected in order to help limit the
transient voltage surge that occurs when large short
circuit currents are interrupted. The default shutdown
speed will work for most applications so adjustment is
usually not necessary. In this case CS can be omitted.
In some applications using large modules or parallel
connected devices it may be helpful to make the shut-
down even softer. This can be accomplished by
connecting a capacitor (CS) at Pin 27. A curve showing
the effect of CS on short circuit fall time (t1, t2) is given
in the characteristic data section of this data sheet. The
waveform defining the fall time characteristics is shown
in Figure 3.
������������
������
��������
���
���
�������������
����������
������
�������
�������������
���
��
��������
�����
��
��
���
���
���
Figure 3. Adjustment of ttrip and Slow Shutdown Speed
Rev. 8/06
7
Share Link: 