TEA2029 Ver la hoja de datos (PDF) - STMicroelectronics
Número de pieza
componentes Descripción
Fabricante
TEA2029 Datasheet PDF : 47 Pages
| |||

TEA2028 - TEA2029 APPLICATION NOTE
It is therefore deduced that the system can follow
all input phase variations without producing any
static error.
In practice, there will be a slight error due to the
input bias current ”IB” of VCO, which is 0.55µA at
fO = 500kHz. This DC current is delivered by a
phase comparator which will generate a phase
error of :
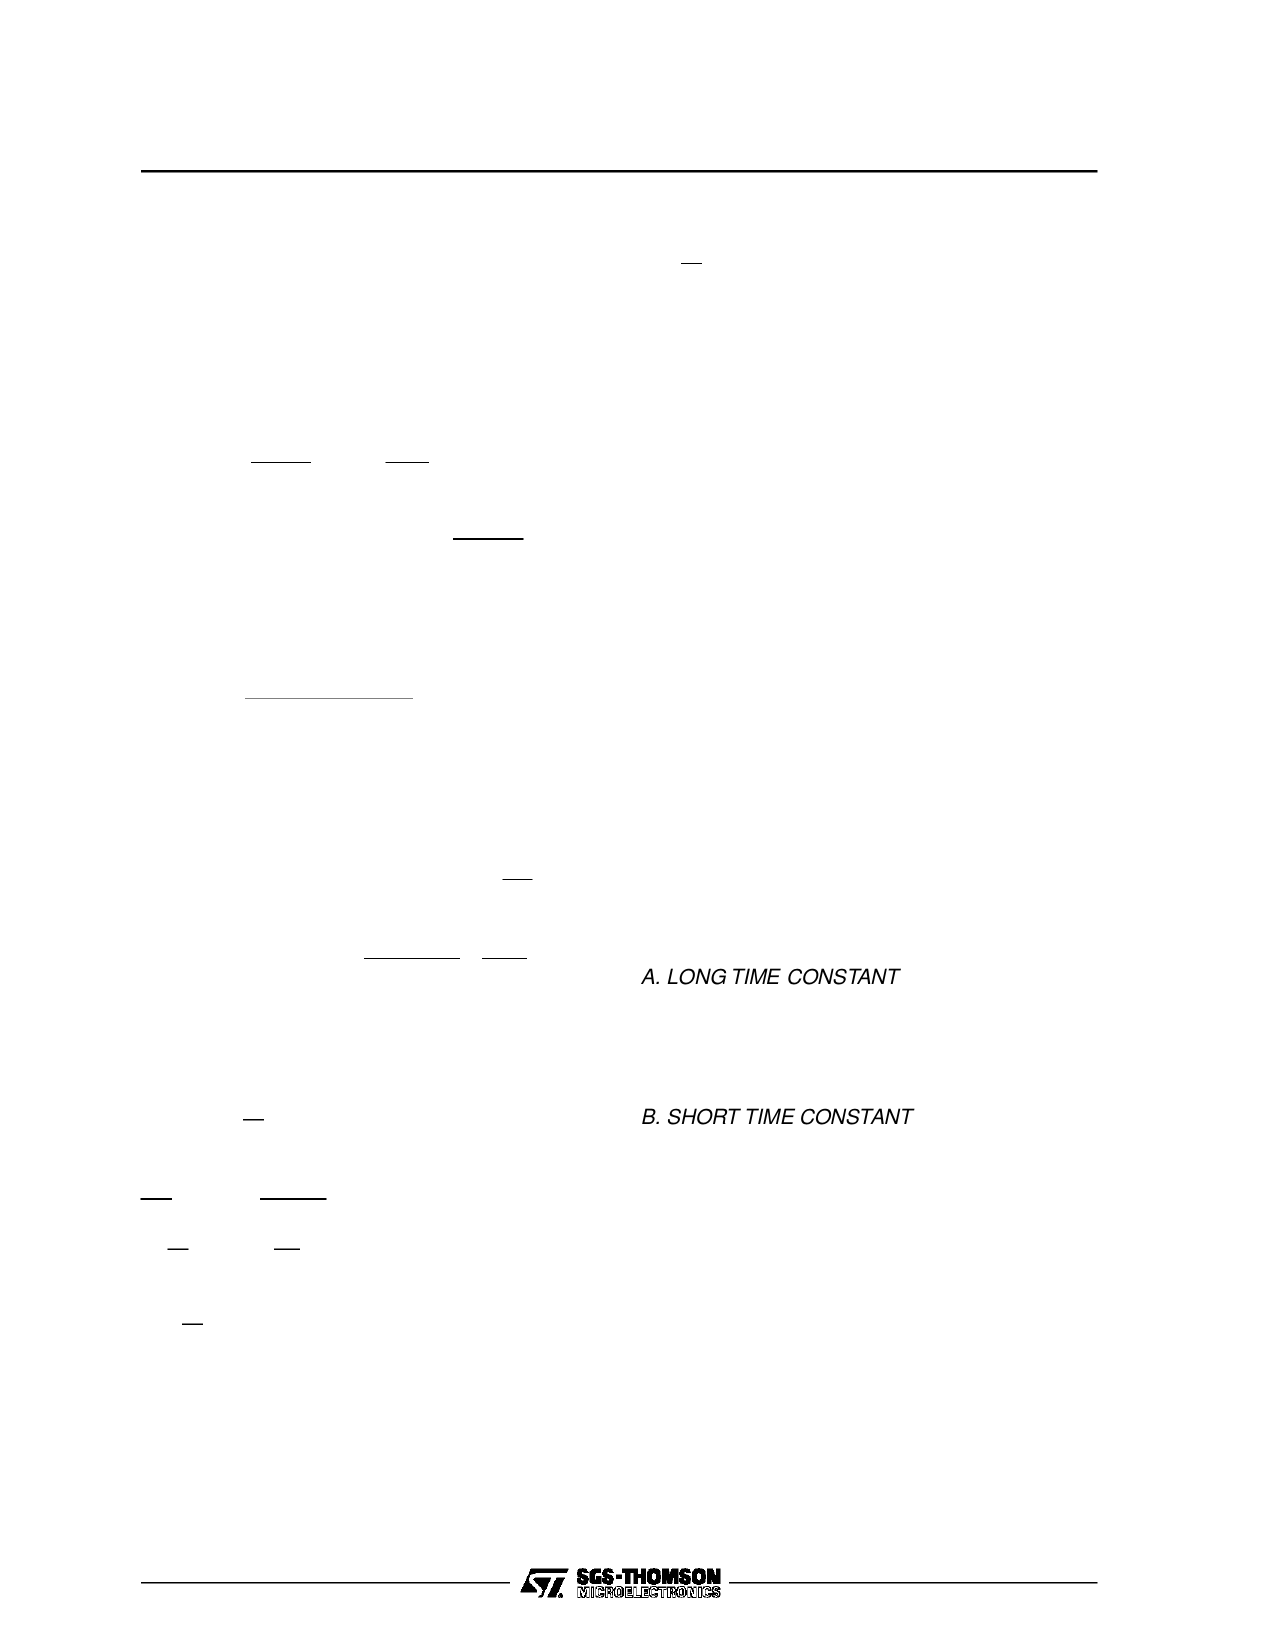
- long time constant :
∆ΦLONG
=
ALIOBNG=
0.55
⋅
10−3
0.16
= 3.4 ⋅ 10-3 rd or 35ns in ∆t
-
short
time
constant
:
∆ΦSHORT
=
IB
ASHORT
=
12ns
These two errors cause a horizontal picture dis-
placement. On a large screen of 54cm wide, this
will be : 64 - 12 = 52µs, which for both modes
corresponds to a shift of :
∆LINE
=
∆ΦLONG−∆ΦSHORT
52
⋅
520
=
0.24mm
It is obvious that such displacement can be fully
neglected.
Response to a Frequency Step
- The input phase is : ΦIN(t) = ∆ωt
which
as
a
function of
(p)
is
:
ΦIN(p)
=
∆ω
p2
- The accuracy is :
lim (ΦIN −
p−>0
ΦOUT)
= lim
p−>0
p
∆ω
+ ABf(o)
=
∆ω
ABR
where R = 500kΩ at f(o)
In this case, the phase error depends on both, the
magnitude of the frequency step and the static gain
ABR.
In
general,
∆f
∆f
which
is
the
open-loop
static
gain,
is
taken into consideration.
∆ω
∆Φ
=
ABR
=
2π∆f
∆t × 2π
=
A
⋅
2
π
⋅
B’
⋅
R
⇒
∆f
∆t
=
AB’R
⋅
2π
TH
(B’ in
kHz/V)
- In normal mode : ALONG = 0.16 mA/rd
⇒
∆f
∆t
=
5.5kHz/µs,
R
= 500kΩ
- In VCR mode : ASHORT = 0.47 mA/rd
⇒
∆f
∆t
=
16.5kHz/µs
Note : The capture range is specified within
± 500Hz with respect to 15625Hz.
Numerical Example
Let’s suppose that in VCR mode there is a fre-
quency variation of ± 100Hz, this will yield a phase
variation of 0.1/16.5, i.e. ± 6ns which, on a 54cm
wide screen, will produce a horizontal shift of
∆LINE = ± 0.06mm !
It is obvious that an excellent image stability is thus
obtained.
V.3.6.2 - Dynamic study
The loop response in transient mode is quite im-
portant. It determines the overall system stability
and the phase recovery time, which are imposed
by the external filter ”f(p)”.
The close-loop transfer function is equivalent to a
second order system. These time constants are in
practice displayed on screen by a bar delivered by
a special pattern generator representing the phase
errors.
The following optimizedresults were obtained from
filter f(p) connected to Pin 22.
Filter component values are :
R1 = 4.7kΩ, C1 = 2.2µF, C = 10nF
A. LONG TIME CONSTANT
- At ∆t of 4µs ⇒ N=18 lines, i.e. τLONG = 1.15ms.
System oscillations are perfectly damped. Image
stability with a noisy video signal is very satisfac-
tory.
B. SHORT TIME CONSTANT
- At ∆t = 4µs ⇒ N = 5 lines, i.e. τSHORT = 0.32ms
- n = 5 lines
One should notice fast phase recovery, naturally
followed by bounced oscillations due to the char-
acteristics of a second order device.
As given in application diagram section 6, an other
alternative would be to use the following compo-
nent values : R1 = 3.9kΩ, C1 = 4.7µF, C = 15nF.
16/46