HFBR-1312T Ver la hoja de datos (PDF) - HP => Agilent Technologies
Número de pieza
componentes Descripción
Fabricante
HFBR-1312T Datasheet PDF : 8 Pages
| |||
5
Transmitter Notes:
1. Typical data are at TA = 25°C.
2. Thermal resistance is measured with the transmitter coupled to a connector assembly and mounted on a printed circuit board;
ΘJC < ΘJA.
3. Optical power is measured with a large area detector at the end of 1 meter of mode stripped cable, with an ST* precision ceramic
ferrule (MIL-STD-83522/13), which approximates a standard test connector. Average power measurements are made at 12.5 MHz
with a 50% duty cycle drive current of 0 to IF,peak; IF,average = IF,peak/2. Peak optical power is 3 dB higher than average optical
power.
4. When changing from µW to dBm, the optical power is referenced to 1 mW (1000 µW).
Optical power P(dBm) = 10*log[P(µW)/1000µW].
5. Fiber NA is measured at the end of 2 meters of mode stripped fiber using the far-field pattern. NA is defined as the sine of the half
angle, determined at 5% of the peak intensity point. When using other manufacturer’s fiber cable, results will vary due to differing
NA values and test methods.
6. Overshoot is measured as a percentage of the peak amplitude of the optical waveform to the 100% amplitude level. The 100%
amplitude level is determined at the end of a 40 ns pulse, 50% duty cycle. This will ensure that ringing and other noise sources have
been eliminated.
7. Optical rise and fall times are measured from 10% to 90% with 62.5/125 µm fiber. LED response time with recommended test
circuit (Figure 3) at 25 MHz, 50% duty cycle.
8. 2.0 mm from where leads enter case.
100
90
80
70
60
50
40
30
20
1.1
1.2
1.3
1.4
1.5
1.6
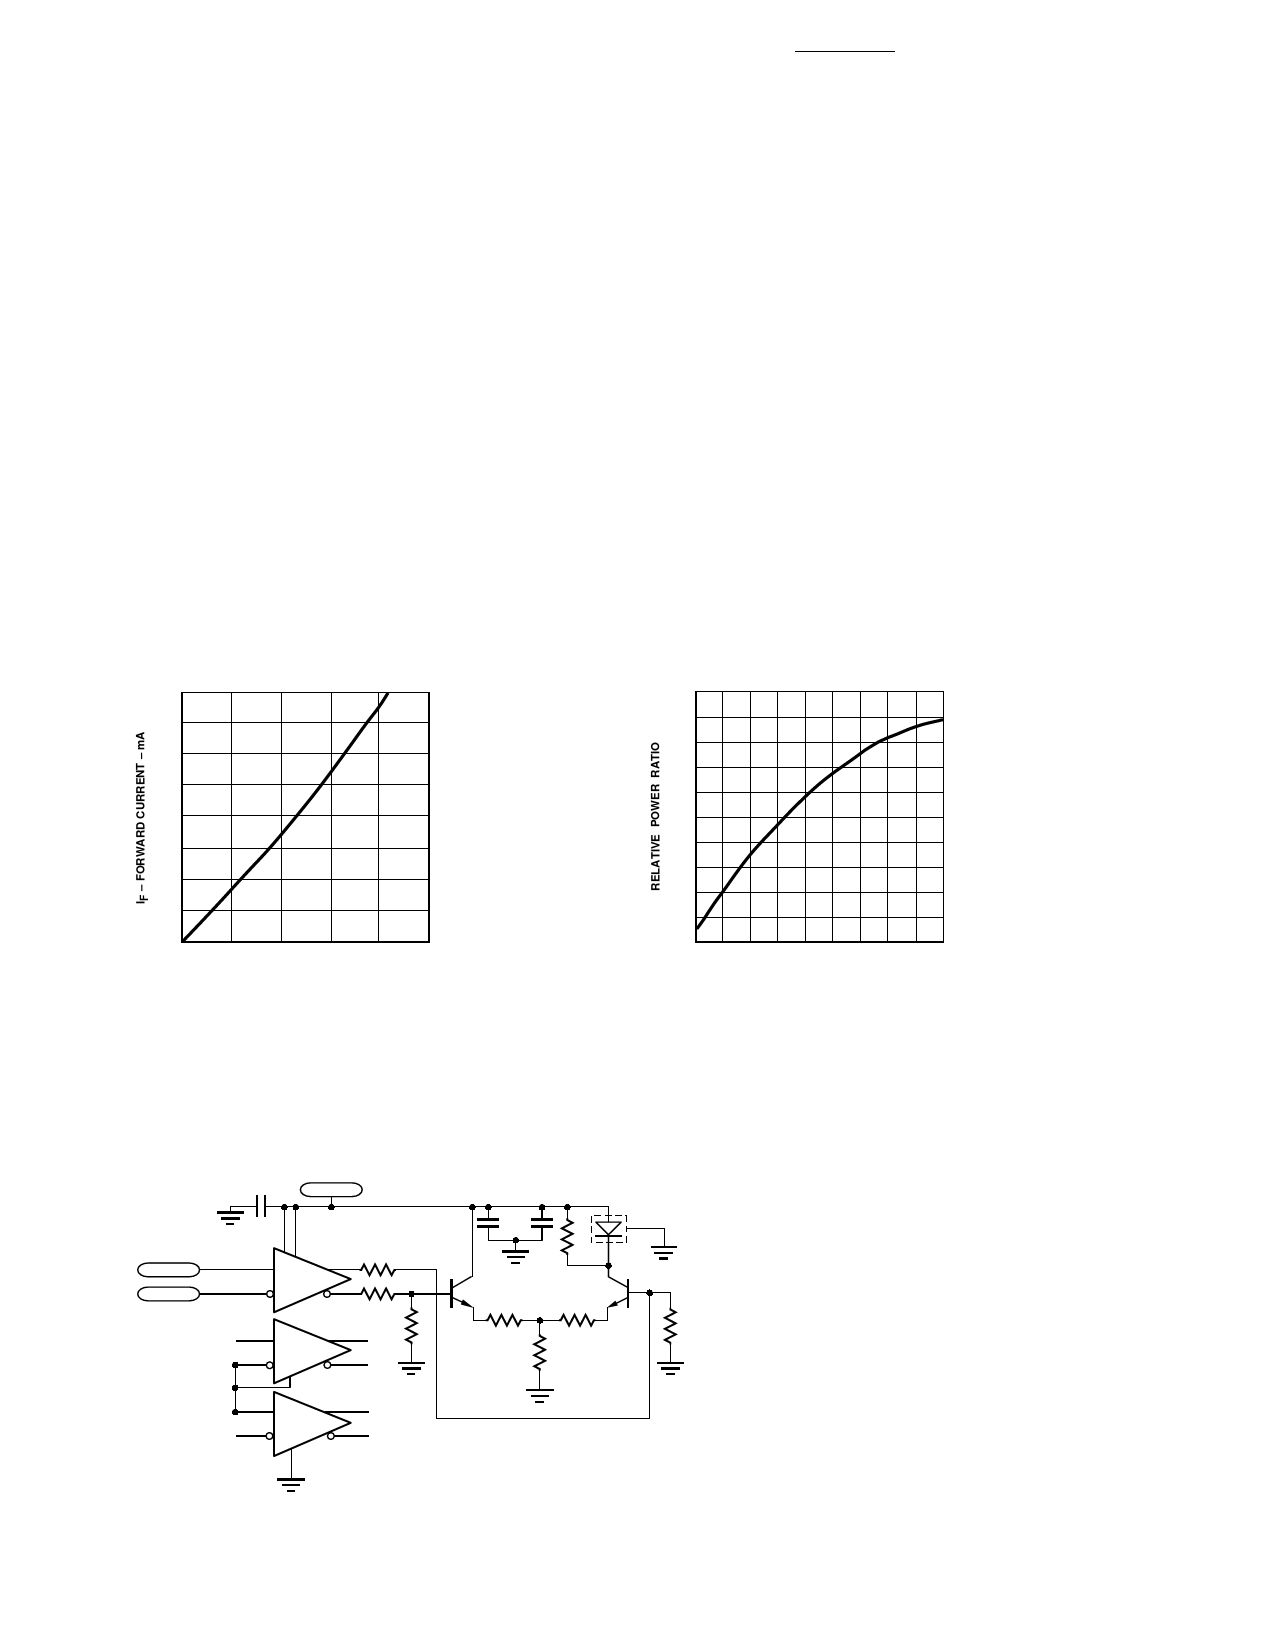
VF – FORWARD VOLTAGE – V
Figure 3. Typical Forward Voltage and Current
Characteristics.
1.2
1.1
1.0
0.9
0.8
0.7
0.6
0.5
0.4
0.3
0.2
10
30
50
70
90
IF – FORWARD CURRENT – mA
Figure 4. Normalized Transmitter Output Power vs.
Forward Current.
DATA +
DATA –
0.1 µF
+ 5.0 V
1
16
5
3
MC10H116A
4
2
10
7
MC10H116B
9
6
11
Vbb
13
15
12 MC10H116C
14
8
75 Ω
75 Ω
220 Ω
10 µF
TANTALUM
0.1
µF
HFBR-1312T
2, 6
7
NE46134
3
150 Ω
NE46134
2.7 Ω
2.7 Ω
24 Ω
220 Ω
NOTES:
1. ALL RESISTORS ARE 5% TOLERANCE.
2. BEST PERFORMANCE WITH SURFACE MOUNT COMPONENTS.
3. DIP MOTOROLA MC10H116 IS SHOWN, PLCC MAY ALSO BE USED.
Figure 5. Recommended Transmitter Drive and Test Circuit.
Share Link: 